So, the POC is in full swing and I have to say, even without the use cases we are pretty sold on the platform. We came in with a problem oriented feature document (See: Pragmatic Marketing Process). This document outlined the use cases that we wanted the POC to solve for.
Problem
At Shiftkey, our rapid growth has created a number of blindspots in our data architecture. The result is that we are less likely to…
catch gaps in data when they occur prior to being notified by our end users;
understand who is using our platform and how much;
understand how changing a data workflow will impact upstream and downstream components;
onboard new employees quickly.
My thought process is to focus on specific use cases in order to understand the value of a product. This is a successful process in my experience. It keeps the project free of distraction and allows for true evaluation.
The sales team over at Monte Carlo has been outstanding and working with us on this POC. Now, onto the evaluation.
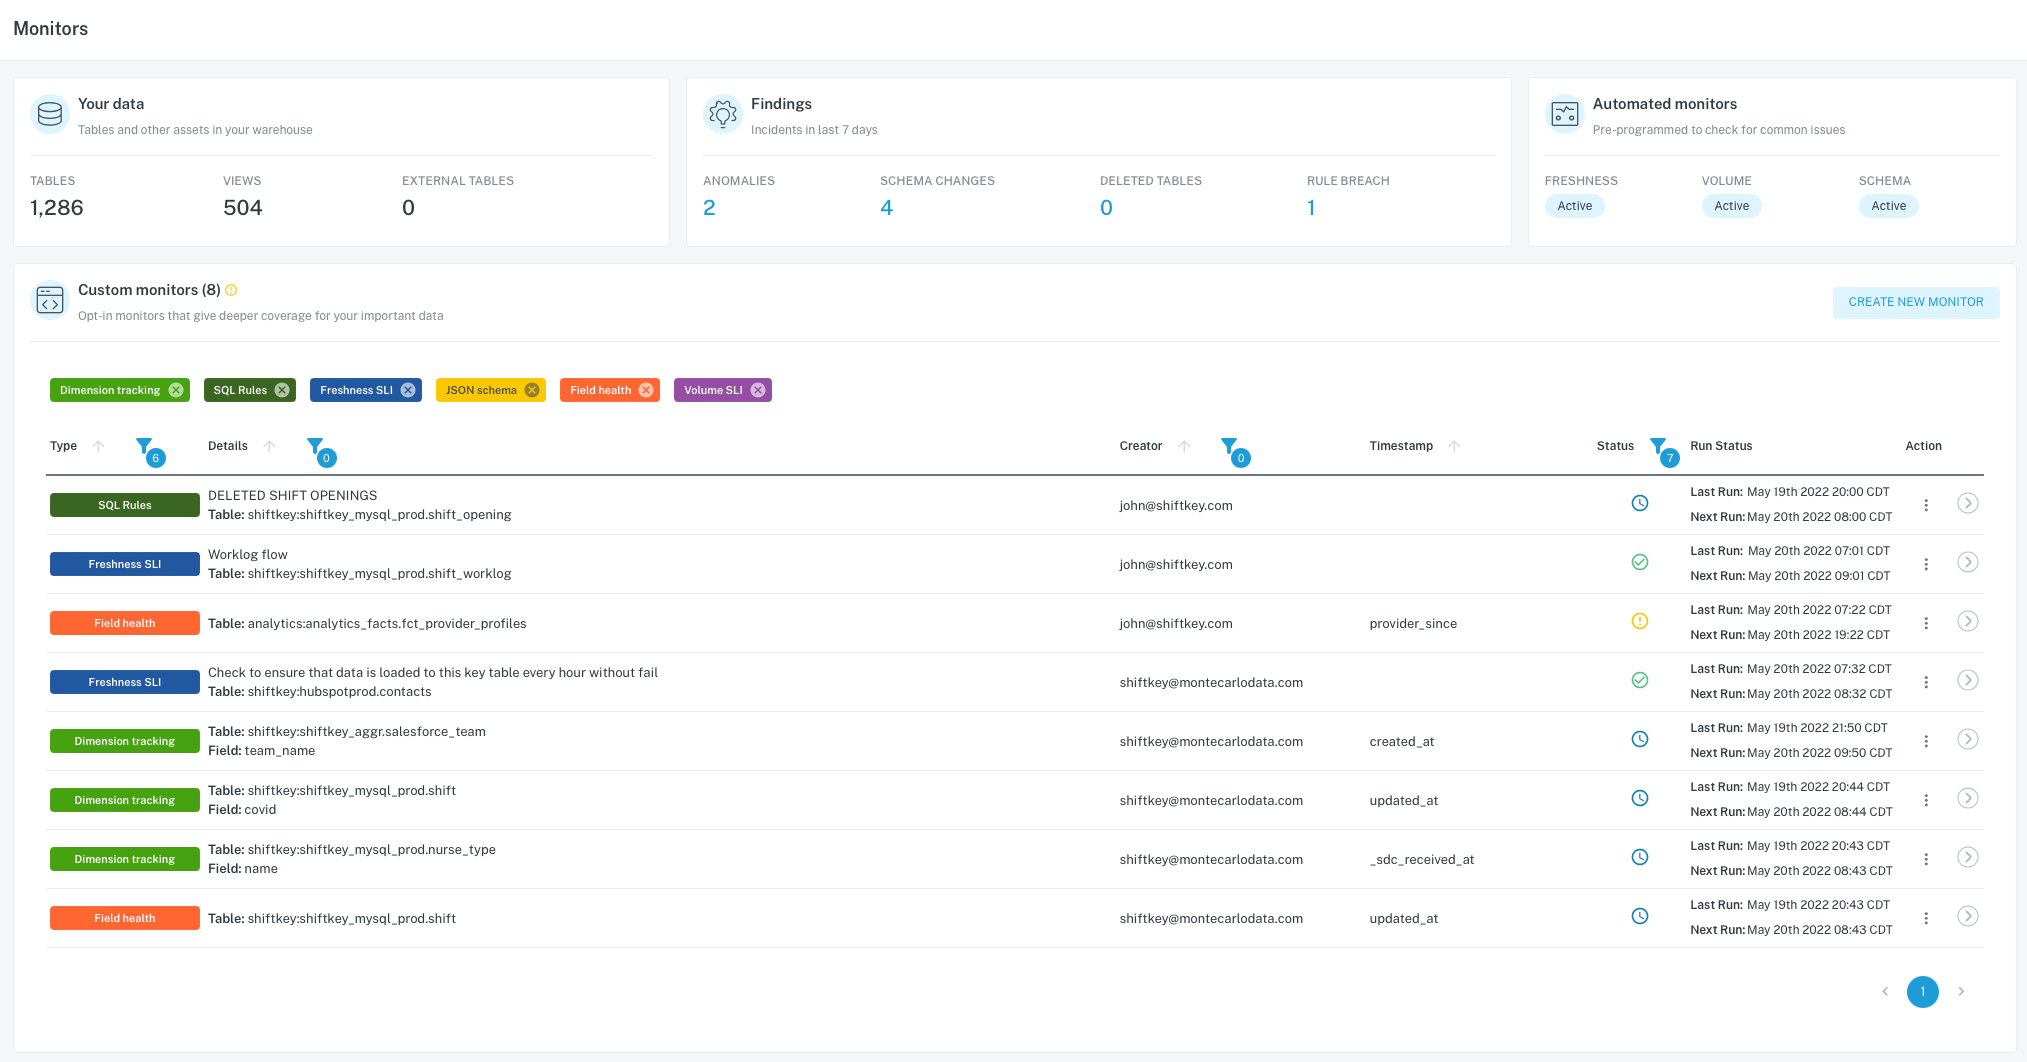
Catch gaps in data when they occur prior to being notified by our end users..
Rating: A
Even during the “AI training” time, the platform performed well in all capacities. Some of the items that it surfaced, the team was already aware of but the POC revealed more benefits than we thought. Not only did we receive these reports and notification but the platform actually streamlined the investigation of those incidents. I estimate we saved 50% of the time to investigate because the platform classifications actually told us where the issues were and the type.
There is huge benefit to this in other ways too. We are growing so fast here at Shiftkey, having new engineers be able to contribute to the maintenance of the platform quickly makes it that more valuable.
Understand who is using our platform and how much..
Rating: B+
Full disclosure, we haven’t really looked at this one all that much. But investigating the platform, it is apparent to me that we have access to more than just simple awareness. Not only can you see which names and service accounts are accessing our warehouse, but we can see the queries and frequency of run. This information is crucial to us for:
- troubleshooting issues
- governance
- onboarding
- QA
- budget forecasting
It is interesting to be able to see the queries because it can also educate analysts on platform structure. An analyst can look at queries to see how the system generates data. When you have a platform that is very operational, as we do, this will increase onboarding time and time to value.
Understand how changing a data workflow will impact upstream and downstream components
Rating: A+
Imagine if you could see visualize the tables that are used to build a table or report. A picture is worth a thousand words.
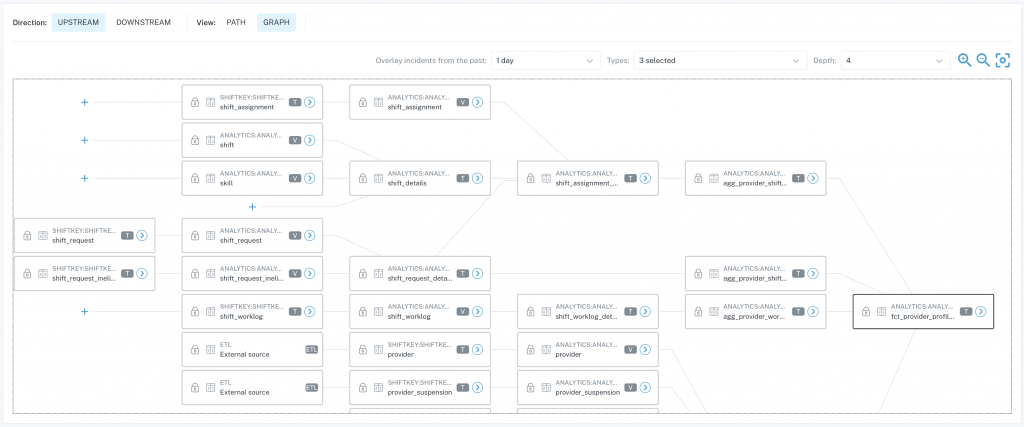
You can also see the reports, tables, Looker Explores/Views that are derived from that same table.
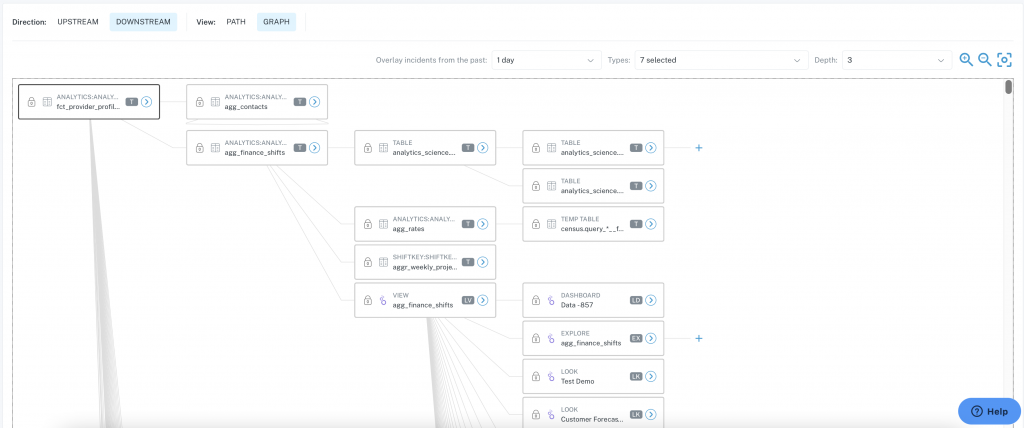
This is crucial information for teams working on database updates to understand what will happen if they change things.
Onboard new employees quickly..
Rating: A
As you read above, all of the other items contribute to quickly being aware of the platform. The Monte Carlo platform has enough information in addition to the awareness to speed that onboarding up. Table structure, report dependencies and architecture and more are available to help new employees see how data is organized.