Where do I begin? It is easy to say you want an LLM, but as new as the technology is, it can be overwhelming. Language models have gained immense popularity…
The Power of Business User Input: Why Analytics Alone Isn’t Enough for Effective Decision-Making
In the era of big data, analytics has become a key driver of decision-making across many industries. Organizations are investing heavily in data analytics tools and technologies to gain insights…
How to determine a company’s Analytics Intelligence.
When I enter a company I look to see where it is from an analytics intelligence perspective. Analytics Intelligence is defined as: Analytics Intelligence: The amount of understanding within an…
Data Observability: Monte Carlo : Use Cases
So, the POC is in full swing and I have to say, even without the use cases we are pretty sold on the platform. We came in with a problem…
Data Observability: POC, Implementation and Process with Monte Carlo
A modern data stack has a number of components that you can’t live without. Until about a month ago, I’m really embarrassed to say that I never considered or even…
Challenging Everything We Know About Type 2 Diabetes Management, with Data
Diabetes is a disease of the unengaged. So, how do you influence the behavior of 100 million Americans(1) who are living with or are in the first stages of diabetes?
Conquering Healthcare Analytics: Consolidate, Prepare, De-identify and Analyze
In a previous article, Conquering Analytics: Collection, Validation, Enhancement, Accessibility, I spoke about how to handle data in a complex, general, analytics system. In this article, I am going to…
Conquering Analytics: Collection, Validation, Enhancement, Accessibility
In the SaaS world, analytics powers existing development and should determine the next steps in the path for the future of products and services. So if I asked the question,…
The Anatomy of Good Visualization
What makes for a good visualization? There are a number of components that are necessary for a visualization to be valuable. Just having a line (series item) represent some segment…
A new era of intelligent, lightweight ‘dashboards’
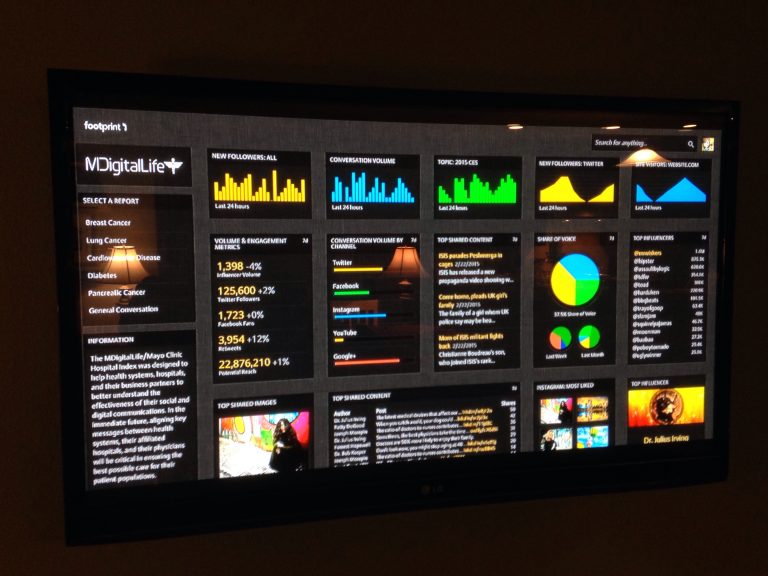
Dashboard development has become novel in the last 5 years. Everyone has a dashboard that is branded “easy”, “intuitive” or “custom”. I have interactions with clients and the number one…

