In the SaaS world, analytics powers existing development and should determine the next steps in the path for the future of products and services. So if I asked the question,…
Conquering Analytics: Collection, Validation, Enhancement, Accessibility
-
- 5 min
In the SaaS world, analytics powers existing development and should determine the next steps in the path for the future of products and services. So if I asked the question, how do you define analytics? User details and behavior? Application performance? Reporting? The answer shouldn’t be complicated.
When I think of answering that question, I first take a top-down approach to understanding how analytics fits into the life-cycle of a product/service. There are 4 main components to successful analytics implementation.
- Collection of Data
- Validation of Collected Data (including processing)
- Enhancement of Data
- Accessibility of Data
It seems pretty logical but many companies miss the mark in differentiating these separate pieces. Each one is a dependency of the item before it. They are also in order of importance. Remember, you can’t go back and add analytics if you don’t collect it from the beginning. You can reprocess all the other steps but collecting the data to begin with is the single most important step in the process. Analytics should be considered a workflow, not steps to be handled independently. Planning for analytics is not about what you know, it is about planning for what you don’t know. A big mistake is designing reports and then collecting data as part of a requirement. That is backwards. Reporting is not analytics. Repeat that a hundred times.
Analytics should be considered a workflow, not steps to be handled independently.
Collection of Data
As I mentioned before, collection is the single most important part of the analytics workflow. Some important considerations for the collection of data is to look at all interaction points between users and your application as well as transactional events (submissions). Visual and direct interaction points should be tracked separately to produce a clear picture of system performance. Im not going to go into the technical architecture or details in this post but you should be able to implement scripts that track common items like clicks but also other non-standard events like “in view” and “on hover” events. There are many others but you should definitely consider those visual interactions as part of your strategy. The most important thing is that you collect all events, even if you aren’t planning on using them now. You cannot go back later and collect them. Analytics are a point forward feature of application development. You can go back and analyze later, but take the ABC approach. “Always Be Collecting”.

Validation of Collected Data
The second phase of the workflow is validation of the events captured through the process. You have probably heard the phrase garbage in, garbage out. If you are not collecting accurate, validated information, you can’t be expected to pull actionable insights from anything you collect. Have some validation controls in place that when data is collected, at least some basic business logic is applied to help keep your data clean. There are levels of validation rules and depending on how much control you need, that process is adjusted. You could decide that you don’t want any non-valid events get added to the system. In that case, data would not be stored and notifications would go out to responsible parties to fix the issue. You could also decide you want to allow that invalid data to still be collected, but in that case, you should flag the data as such so you don’t use it in some of your business intelligence needs. You could also write logic that looks for common issues and attempts to repair the data. If you choose that, you should be careful to not lose valuable information.
During validation, you should also consider processing rules that help to classify and tag data. For example, if you collect content rich events, you could process the content and infer topics/categories and then tag that content. This enriches the data and adds a much deeper meta-layer than the event would have alone. This is done during collection and validation because it is much more efficient to tag data on the way in during validation than post-process.
Enhancement of Data
Enhancement of data allows you to post-collection process and provide additional service layers on top of the data. The difference between what happens here and what happens during validation should be what is considered appropriate for the data set. If you have to process every event coming into the system, it happens at the validation layer. If you have to only process subsets of specific classes of data, it happens as a service in the enhancement phase.
A good rule to follow also when you are enhancing data is to build on the original record and replace instead of creating entirely new data sets. This of course is only a recommendation. I have seen lots of really good enriched data sets that live on their own. Sometimes if you are translating formats, you have to collect in a different data store, thus creating new records.
You also should run each enhancement process separately in the workflow. If you are doing sentiment analysis on content for example, you would collect all your events, validate those events, then run a process that analyzes the specific set of data and determines positive, negative, neutral sentiment (adding that to the meta-data). After that process completes, you may run another enhancement job that scores the content based on a number of factors (adding that to the meta-data).
Accessibility of Data
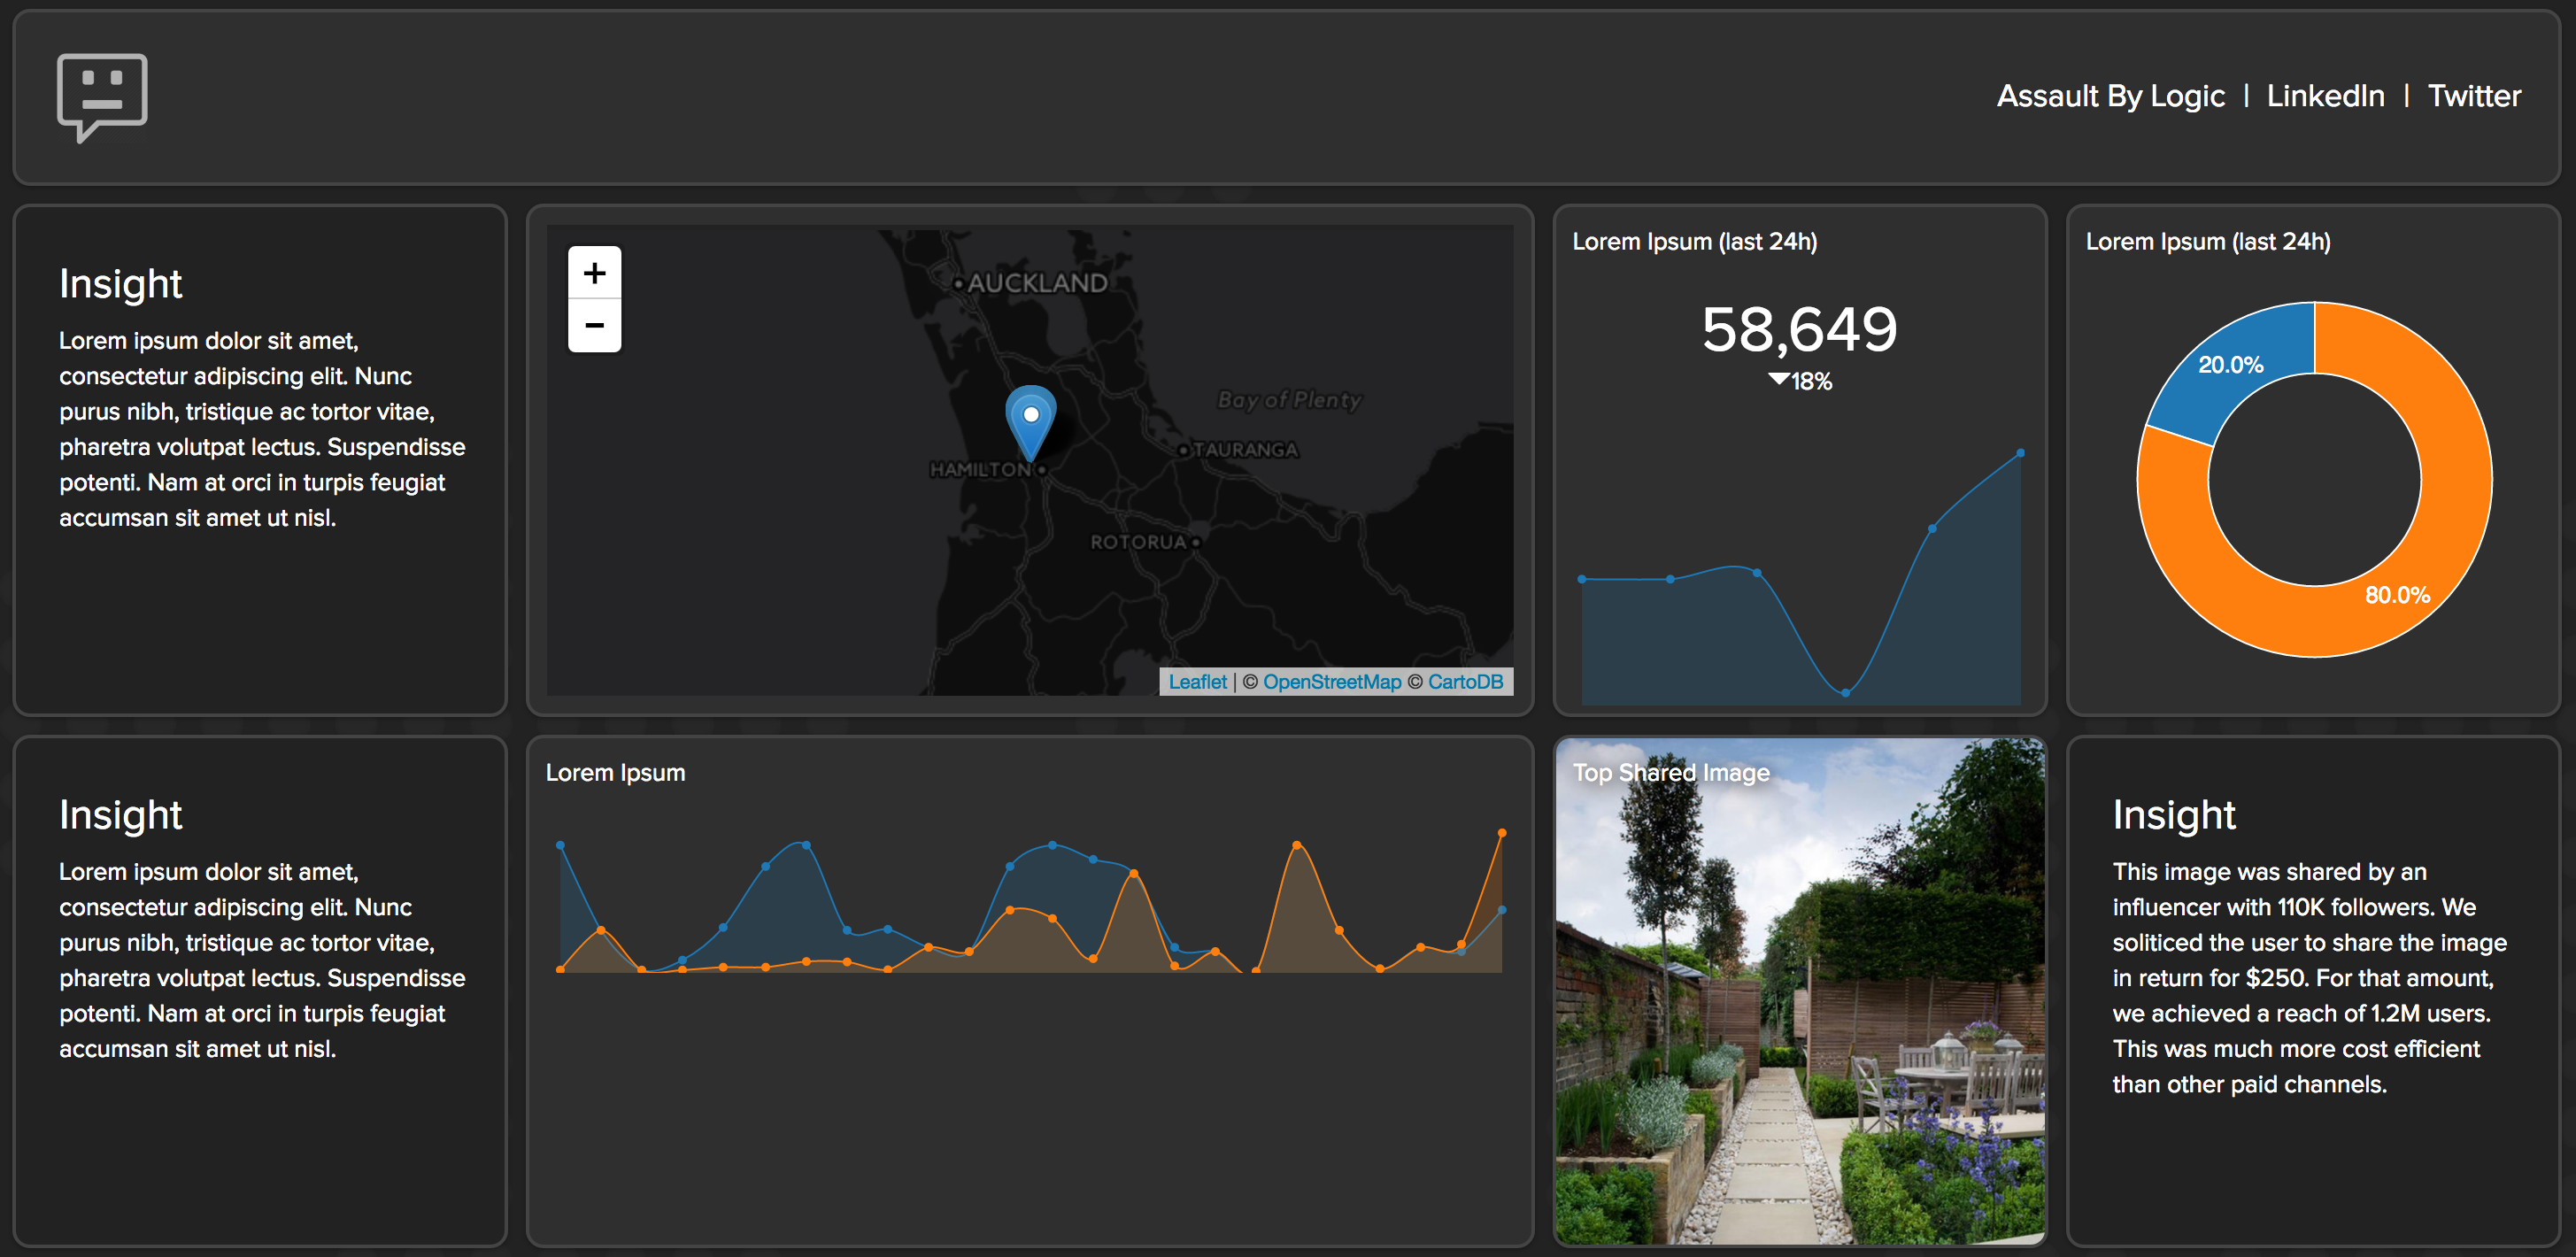
Reporting? Nope. The goal of an analytics group should be to empower the business to make better decisions by making product data available to the organization. Some organizations can and should build reporting tools as part of their analytics strategy. The differentiation is clear. Focusing on the empowerment by making data available should be the primary goal. In today’s enterprise world, dashboards are commoditized and clients have to login to 200 separate locations to see all their data. Reporting should absolutely have importance, but making data accessible is the first priority.
Access should also be standardized. The forms of that standardization should be specific to users. The order in which these should be considered are:
- Serviceable, RESTful APIs (user: developer)
- Alternative shapes of data returned from API (user: developer/business analyst) – format CSV,JSON
- Reporting integration (user: developer > marketing, business power users)
- Monetizing data streams (user: external developers / communities)
Minimize Perspective
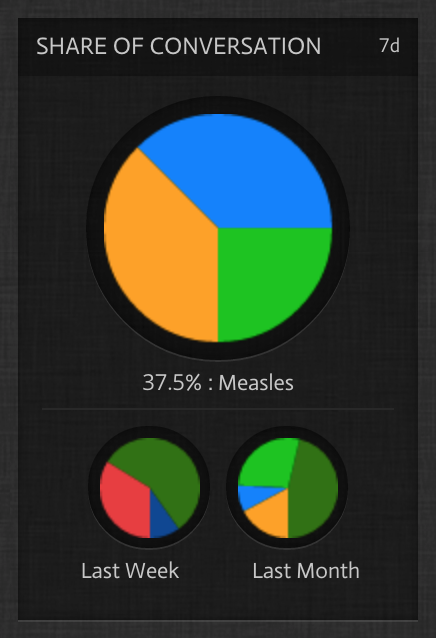
When you have lots of alternative, queryable access to your data, then you run the risk of having too many perspectives of analytic definitions. Without some controls in place, there are lots of possible issues with how analytics are formed. Different perspectives can lead to inconsistent results.
Some organizations take a micro-approach to analytics, focusing on single aspects of application specific performance. While this may serve a quick use purpose, if they grow, they will soon come to regret this decision. If you are building a network of data that will grow and it is predicated on speed, you will inevitably miss a lot of opportunities. Analytics is a bookend function of an application environment. You put time in the beginning and visualize it at the end. But the reality is that the more time you put into planning and the more time you integrate analytics into your discovery process, the more refined and significant your return is. You can always build reporting later, but you cannot ever go back and collect data you wish you would have.
Collect everything. Even if you know you don’t need it.
A good rule of thumb, collect everything. Even if you know you don’t need it. You will be glad you did. Analytics has a way of biting you in the ass. The second you think you are smarter than the system, you will realize you forgot something.

Analytics is so much more than reporting. Analytics is the capability and capacity to measure a system based on any outside factors and compare those against items that positively or negatively affect their performance. In addition to that data, it is also deriving actionable insights from those results. Without comparison, analytics are just numbers. You have to relate them to something.