
As a business leader or data team member, understanding the end to end process for all your business functions is critical to making decisions or helping others make those decisions. When I join company, I always look to see if there are documented workflow diagrams that outline the business processes for the organization. I did it at Shiftkey and many of the companies I have worked for. It was (and is) by far the most critical part of being a data leader. It doesn’t have to be complicated, it just needs to document, step by step, your process of getting from point A to point Z. Examples of this are:
- New Customer Signup to Purchase
- Customer Support Request to Support Ticket Closed
One important component is to make sure you are capturing pain points and notes on the processes. These can be helpful to identify manual behaviors that can be automated. They can also highlight bottlenecks of efficiency and redundant services.
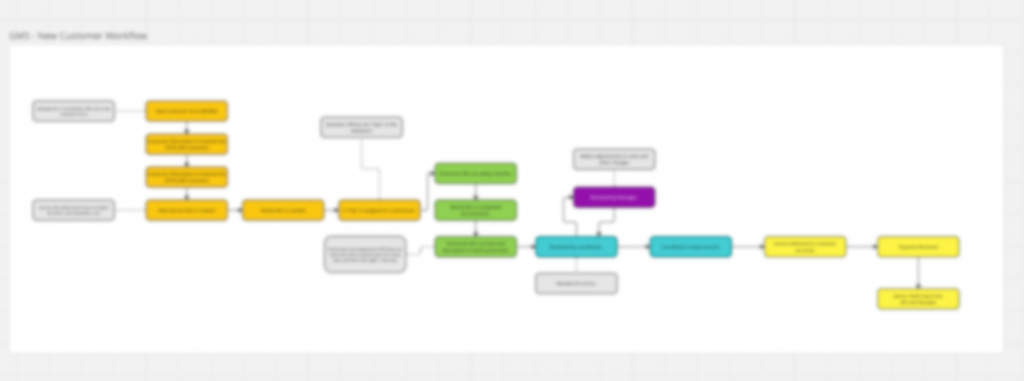
In my short time at Gallo, Ive been trying to document these processes so I can build efficient and accurate data workflows and highlight the opportunities for efficiency. You may think it’s out of scope for your role as a data person, but you would be incorrect. You can highlight these opportunities and pass them along to all parts of the business (operations, finance, product/design, etc). An example is below (blurred out for obvious reasons). Each color representing a different process owner and the grey boxes for notes.
1. Clarity and Communication
Business process diagrams provide a clear, visual representation of the company’s operations, making it easier for everyone in the organization to understand how processes work from start to finish. This visual clarity facilitates better communication across departments, ensuring that all team members are on the same page regarding how tasks are performed and how different processes interconnect.
2. Identification of Inefficiencies and Bottlenecks
By mapping out each step in a business process, data leaders can easily identify inefficiencies, bottlenecks, and redundant steps that may be costing the company time and resources. This visualization allows for a more straightforward analysis of where processes can be streamlined or improved, leading to more efficient operations and potentially significant cost savings.
3. Opportunities for Automation
With a detailed understanding of the current workflow, data leaders can pinpoint manual tasks that could be automated. Automation not only saves time but also reduces the risk of human error, leading to more reliable and consistent outcomes. Identifying automation opportunities is a key step in driving digital transformation and innovation within the company.
4. Enhanced Decision Making
Business process diagrams equip data leaders with the knowledge needed to make informed decisions about process improvements, resource allocation, and strategic planning. Understanding the end-to-end process helps in assessing the impact of potential changes or investments, ensuring that decisions are data-driven and aligned with the organization’s goals.
5. Cross-functional Collaboration
Documenting business processes with diagrams encourages collaboration between different departments. By highlighting each department’s role within a process and identifying shared pain points, data leaders can foster a more collaborative environment. This cross-functional collaboration is essential for holistic improvements and innovation within the organization.
6. Scalability and Training
For growing companies, having documented processes is key to scaling operations efficiently. Business process diagrams serve as training materials for new employees, helping them to understand their roles and the broader organizational processes quickly. This documentation supports the scalability of operations by ensuring that process knowledge is not siloed but shared across the organization. At Shiftkey, my team would send these documented flows to every new hire so they could understand how we work from day 1.
7. Continuous Improvement
Finally, business process diagrams are not static; they should be updated regularly to reflect changes in the organization’s processes. This commitment to continuous improvement helps companies stay competitive and responsive to market changes. Data leaders play a crucial role in this process by using data to drive process optimization and innovation.
The use of business process diagrams is a fundamental practice for data leaders aiming to enhance operational efficiency, foster innovation, and support strategic decision-making. My work at Gallo and previous experiences underscore the transformative potential of well-documented and analyzed business processes, emphasizing the importance of this practice in data-driven leadership. Give it a try, it will make you an SME on all the things in your business which makes you an even better data builder.