Addressing Churn
Addressing customer churn is a crucial aspect of maintaining a healthy and sustainable business. Churn, the rate at which customers stop doing business with your company, can significantly impact revenue and growth. Effectively communicating insights about churn to stakeholders is vital for driving strategic decisions. In this blog post, I will explore some of the best practices for delivering data on customer churn, along with a few practical examples.
Understanding Churn
Before diving into the best practices, it’s essential to understand what churn is and why it happens. Churn can be categorized into voluntary and involuntary churn. Voluntary churn occurs when customers decide to leave, often due to dissatisfaction with the product or service. Involuntary churn, on the other hand, happens due to reasons beyond the customer’s control, such as payment failures. each of these is business critical to understand as decisions are made based on trying to lower churn.
Best Practices for Delivering Data on Churn
1. Segmentation and Personalization
Example: Suppose you’re a subscription-based SaaS company. Segment your customers based on factors such as tenure, usage patterns, and demographics. By doing so, you can tailor your retention strategies more effectively. For instance, new users might need more onboarding support, while long-term users might benefit from loyalty programs.
Data Delivery: Create dashboards that allow stakeholders to view churn rates by segment. Use visualizations like heat maps to highlight high-risk segments. Interactive elements can help stakeholders drill down into specific customer groups and understand the underlying reasons for churn.
The more data points you capture in the process, the better your analysis and segmentation will be.
2. Predictive Analytics
Example: Utilize machine learning models to predict which customers are at the highest risk of churning. For example, a telecom company could analyze call patterns, billing data, and customer service interactions to forecast churn probabilities.
Data Delivery: Develop predictive churn models and integrate them into your business intelligence tools. Provide stakeholders with clear, actionable insights, such as a list of at-risk customers and recommended interventions. Visualizations like risk scores and trend lines can help convey the urgency and potential impact of churn.
Everything relies on signals. If you can instrument your data platforms with reliable event data, you can better assess risk and take action before they churn.
3. Cohort Analysis
Example: An e-commerce company might perform cohort analysis to understand the behavior of customers who joined during different time periods. This can reveal trends such as whether customers acquired during a particular marketing campaign are more likely to churn.
Data Delivery: Present cohort analysis in a manner that is easy to interpret. Use line charts or bar graphs to show the retention rate of different cohorts over time. This helps stakeholders identify patterns and assess the effectiveness of various strategies and campaigns.
This is critical to track so you can see how new features and processes affect customer retention. If you launch a new onboarding feature in March and the cohort of new users from March has lower churn 6 months later, you can assume the feature had a positive effect. This is also why you shouldn’t roll out too many features at the same time. The noise will mask positive/negative behaviors.
4. Customer Feedback and Sentiment Analysis
Example: A fitness app could analyze customer reviews, survey responses, and social media mentions to gauge satisfaction and identify common pain points that lead to churn.
Data Delivery: Implement sentiment analysis tools to process and visualize customer feedback. Word clouds and sentiment trend graphs can provide a quick overview of customer sentiments. Highlighting frequently mentioned issues and their sentiment scores can help prioritize areas for improvement.
5. Financial Impact Analysis
Example: Calculate the financial impact of churn by estimating the lifetime value (LTV) of a customer and comparing it to the churn rate. For instance, a subscription service could quantify how much revenue is lost per churned customer and identify the break-even point for retention efforts.
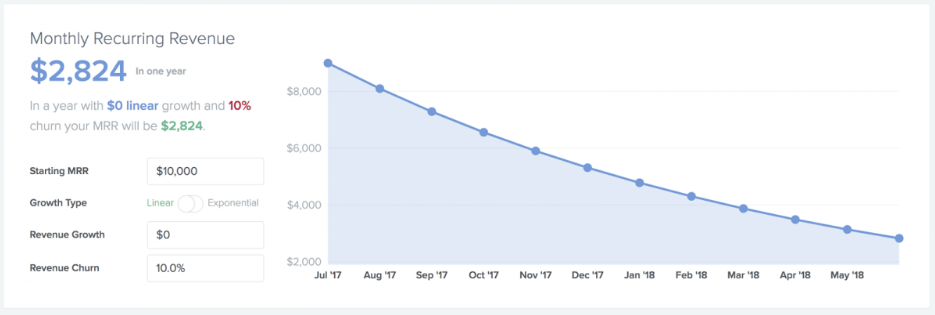
Data Delivery: Use financial dashboards to illustrate the monetary impact of churn. Include metrics like LTV, churn rate, and the projected revenue loss. Waterfall charts can effectively show how churn affects the overall revenue and profitability of the company.
Example:

Effectively addressing customer churn requires a comprehensive understanding of your customers and their behavior. By leveraging segmentation, predictive analytics, cohort analysis, sentiment analysis, and financial impact assessment, you can provide stakeholders with the insights needed to develop targeted retention strategies. Delivering this data through intuitive and actionable dashboards ensures that your team can make informed decisions to reduce churn and enhance customer loyalty.
As a data leader, your role is not just to analyze churn but to communicate these insights in a way that drives meaningful action. By following these best practices, you can help your organization understand and mitigate churn, ultimately contributing to long-term success.
For more articles, check out http://johnsteinmetz.net


